On this page:
November 2024
Results
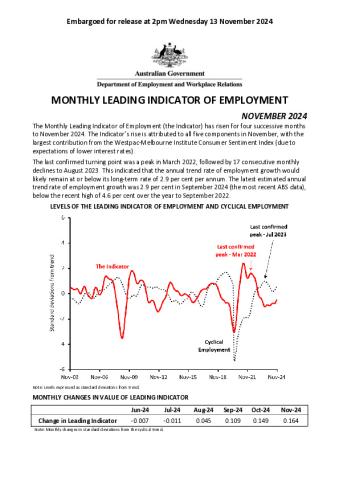
The Monthly Leading Indicator of Employment (the Indicator) has risen for four successive months to November 2024. The Indicator’s rise is attributed to all five components in November, with the largest contribution from the Westpac-Melbourne Institute Consumer Sentiment Index (due to expectations of lower interest rates).
The last confirmed turning point was a peak in March 2022, followed by 17 consecutive monthly declines to August 2023. This indicated that the annual trend rate of employment growth would likely remain at or below its long-term rate of 2.9 per cent per annum. The latest estimated annual trend rate of employment growth was 2.9 per cent in September 2024 (the most recent ABS data), below the recent high of 4.6 per cent over the year to September 2022.
Levels of the Leading Indicator of Employment & Cyclical Employment

Note: Levels expressed as standard deviations from trend.
Monthly Changes in Value of Leading Indicator
| Jun-24 | Jul-24 | Aug-24 | Sep-24 | Oct-24 | Nov-24 | |
|---|---|---|---|---|---|---|
| Change in Leading Indicator | -0.007 | -0.011 | 0.045 | 0.109 | 0.149 | 0.164 |
Note: Monthly changes in standard deviations from the cyclical trend.
Components of the Leading Indicator
| Series | Contribution to Change in Leading Indicator Sep-24 | Contribution to Change in Leading Indicator Oct-24 | Contribution to Change in Leading Indicator Nov-24 |
|---|---|---|---|
| China’s Purchasing Managers Index for Manufacturing Output (October 2024 data) | -0.004 | 0.012 | 0.027 |
| US Yield Difference (10-year vs. 3-month interest rates) (October 2024 data) | 0.033 | 0.048 | 0.049 |
| NAB Forward Orders Index (September 2024 data) | 0.028 | 0.031 | 0.026 |
| Westpac-Melbourne Institute Leading Index of Economic Activity (September 2024 data) | -0.002 | -0.001 | 0.001 |
| Westpac-Melbourne Institute Consumer Sentiment Index (October 2024 data) | 0.054 | 0.060 | 0.061 |
| Change in Leading Indicator: | 0.109 | 0.149 | 0.164 |
Note: The cyclical components of each series contribute to the monthly movements in the Indicator. Each series in the Indicator has the same weight of 20 per cent. The units of measurement for the contributions to change in the Indicator are monthly changes in the standard deviation from the long-term trend.
Technical Notes
The Indicator is designed to provide advance warning of turning points in ‘cyclical employment’ (i.e., the deviation of the centred one-year trend in employment from the centred six-year trend). The average lead time of the Indicator over the series (i.e., the time between a peak or trough in the Indicator and the corresponding peak or trough in cyclical employment) is over a year.
A ‘turning point’ in the Indicator is confirmed when there are six consecutive monthly movements in the same direction after a turning point. A fall (or rise) in the Indicator does not necessarily mean that the level of employment will immediately fall (or rise). Rather, it implies that after a lag, the growth rate of employment may fall below (or rise above) its centred six-year trend rate.
The Indicator is the average of the normalised and standardised cyclical elements of the five series in the table above, which have been shown to lead cyclical employment consistently over a long period. The individual components and the composite Indicator for previous months are subject to revision when new monthly data become available.
Release Details
The Indicator is available on the Department of Employment and Workplace Relations website at Monthly Leading Indicator of Employment Latest Release.
Following extensive consultations with stakeholders, the decision has been taken to discontinue publication of the Indicator. This issue will be the final one.
Contact Officer
Mr Lachlan Kerwood-McCall/Dr Thai Nguyen
Economic Analysis and Policy Section, Department of Employment and Workplace Relations
Email: leading.indicator@dewr.gov.au
Monthly Leading Indicator of Employment – November 2024
The documents (in PDF and Word Format) of the Department of Employment and Workplace Relations Leading Indicator of Employment monthly reports.

