It’s a pleasure to be here on Gadigal land with you all today.
I have to say, as someone who spends most of my time on either Wurundjeri land or Ngunnawal land, it's particularly pleasant to be experiencing the lovely weather that Sydney always puts on. Thank you all for coming. It's a very full room and a very animated room, from what I can hear and see. Thank you for your engagement and your enthusiasm.
What’s happened since
It's been two years since Workforce Australia rolled out.
Since then, we have placed over 400,000 people in jobs. I heard Minister Watt talk about some of the employment data earlier, and the wonderful achievements in the last few years when it comes to employment outcomes, despite the economic conditions.
We've also been bedding down the new system with some very new features, like the PBAS system, while there's been discussion going on in the background and foreground about the nature of how we deliver employment services.
We've had a parliamentary inquiry, we've had an Employment White Paper, we've had a government response to the parliamentary inquiry, which signalled the policy directions of the government when it comes to employment services reform. And now, we all have a new Minister.
That's a bit in two years, while we're continuing to get on with the job of helping people find secure, stable work.
You had heard Minister Watt say earlier, and I'm going to say it as well, large-scale reform will take time. We will be iteratively moving in the direction of the new system as the government response has laid out for us, and we see it starting with the budget measures.
The government's already making targeted changes within the current system, moving us in that reform direction. Some of what Minister Watt spoke about earlier, such as new approaches that really do target and use wage subsidies in a very strategic way – refinements, mutual obligations and other changes are already in the pipeline.
We will be consulting with all of you and other stakeholders to inform the design of the new system and how we get there is as important as where we're going. In the meantime, we in the department are looking to you, to all of us, to work together to evolve our approach to working with participants within the current system.
I echo Minister Watt's emphatic statement from earlier. We don't have to wait to make employment services work better for the people who are in the system. We can and we should be making that happen now within the current system and drawing on the early direction of that system as we see set out in budget measures, and other things we're hearing from the government.
Integrity of employment services
An example of this is the decision of the government, in the budget, to support strengthening the integrity of employment services, including a new complaints mechanism, which will have a complaints dispute resolution process. We'll be leveraging what we know from the good work of our customer service line in the design of this, but at the heart of the idea is to ensure that genuine concerns of participants are responded to appropriately and they are supported to resolve those concerns.
We need to make sure that where there's inappropriate action, there's a transparent and appropriate way of dealing with it. The example that I immediately think of is one that Minister Watt spoke with you about earlier, about the wrongful use of the compliance system to collect the payslip evidence that providers need – or want – to prove and achieve their outcome payments.
I'm pretty disappointed that this kind of thing was coming out in the media and that somehow within our systems, when we talk about system stewardship, we weren't resolving that. Because clearly the Targeted Compliance Framework is not there to put pressure on people who are in a job, or to do something that is in the interests of a provider.
We all understand that we want to make the system work for you and that you get the outcome payment you deserve, but that's not the way to do it. This new complaints mechanism is designed to really provide an outlet for that, to ensure that those things are identified early and appropriately dealt with.
As we consider the small and big ways in which we might evolve the way we're working with participants who are here with us now, today, with pressing need for our help, I'm going to give you some things to think about with respect to how you are supporting a key cohort within your caseloads – women.
Women in employment services
Fifty point seven (50.7) per cent of the Australian population, 47.9 per cent of the Workforce Australian caseload today, and you as service providers, Workforce Australia services, have slightly more women at 49 per cent. So, almost 50/50.
Gender equality is a government priority. The government is determined to improve women's participation and experience in the labour market. This includes initiatives to reduce workforce barriers like the gender pay gap, unpaid and disproportionate caring responsibilities, lack of flexibility, discrimination and bias.
There's been reports in the last couple of years that highlight women have different experiences in the labour force in comparison to men, and this includes their journey into employment.
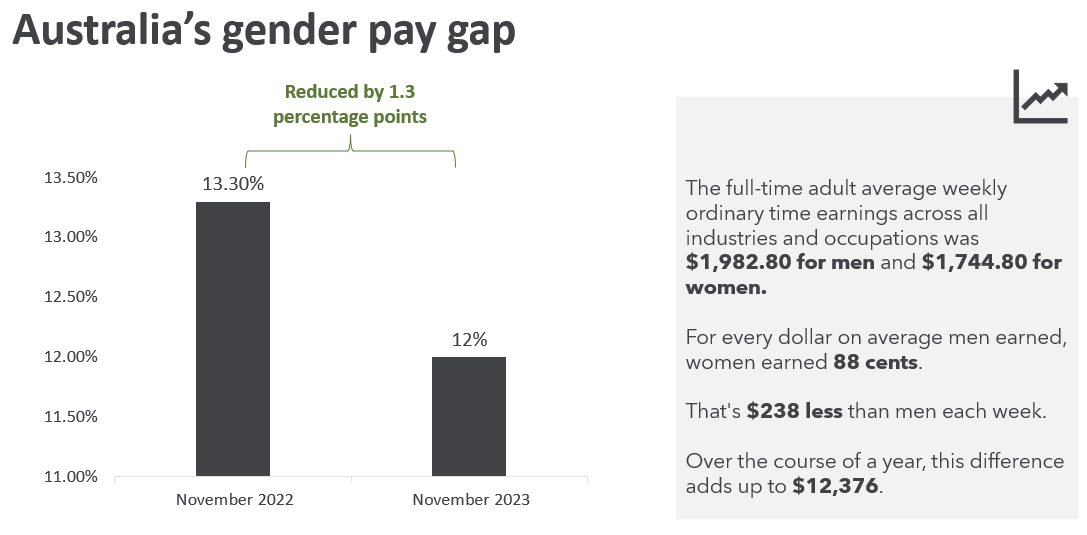
We talk a lot about the gender pay gap. The gender pay gap most recently has come down to an all-time low of 12 per cent, reduced by 1.3 per cent in the last year, which is fantastic.
I have to do what Minister Burke would have done, which is to talk about the changes he made in the Workplace Relations legislation, now being implemented by the Fair Work Commission, that are making a real difference for structural gender equality in the wages system. So, we all agree that's awesome, right? I reckon that deserves applause.
Some of you might remember – I hope you do – last year I spoke to you about some worrying trends we were seeing in our data about how women and men as cohorts, were being treated or supported in the system. We saw that there were some gender gaps evident in several key indicators. This led me to ask you, ‘are you aware of this?’ ‘What do we think about this?’ ‘What's going on?’
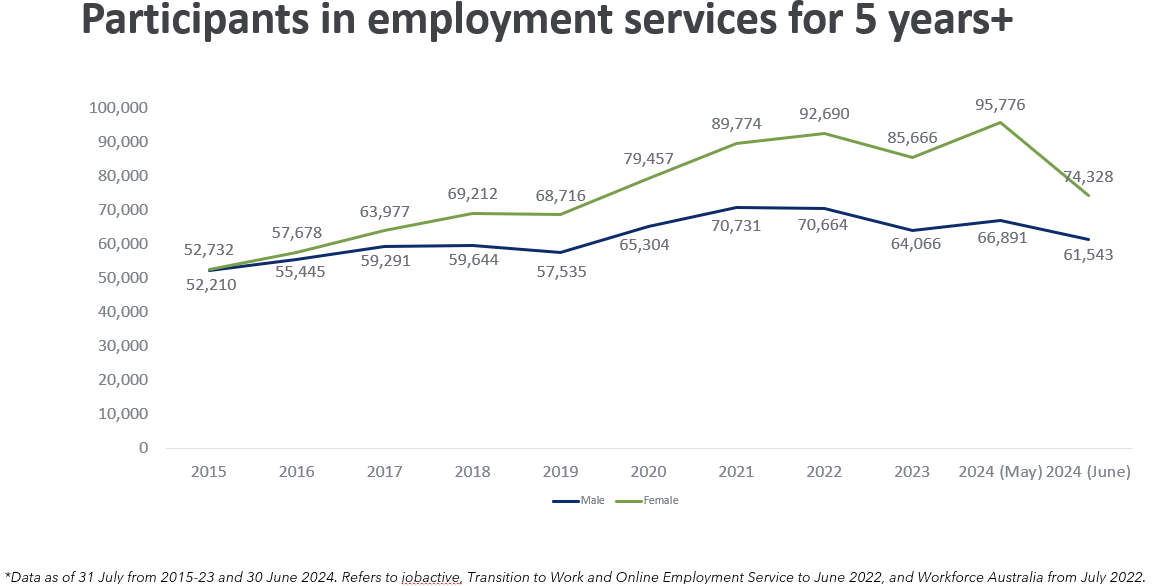
I'm going to return to that data, a year on. To see how all of that is going. I'm going to start with this graph I showed last time. These are participants in employment services for five or more years by gender. The green line is gender, and what you see there is, back in 2015, it was pretty even. Over the last ten years, it's widened. Interestingly, coming back down there, I'm sure there's a story there, but [my] point is, our long-term unemployed cohort is increasingly becoming feminised.
So we have to ask ourselves the question – 'why is it women are staying on the caseload longer?’ Are we not giving them the right kind of help or the same equivalent help as men?
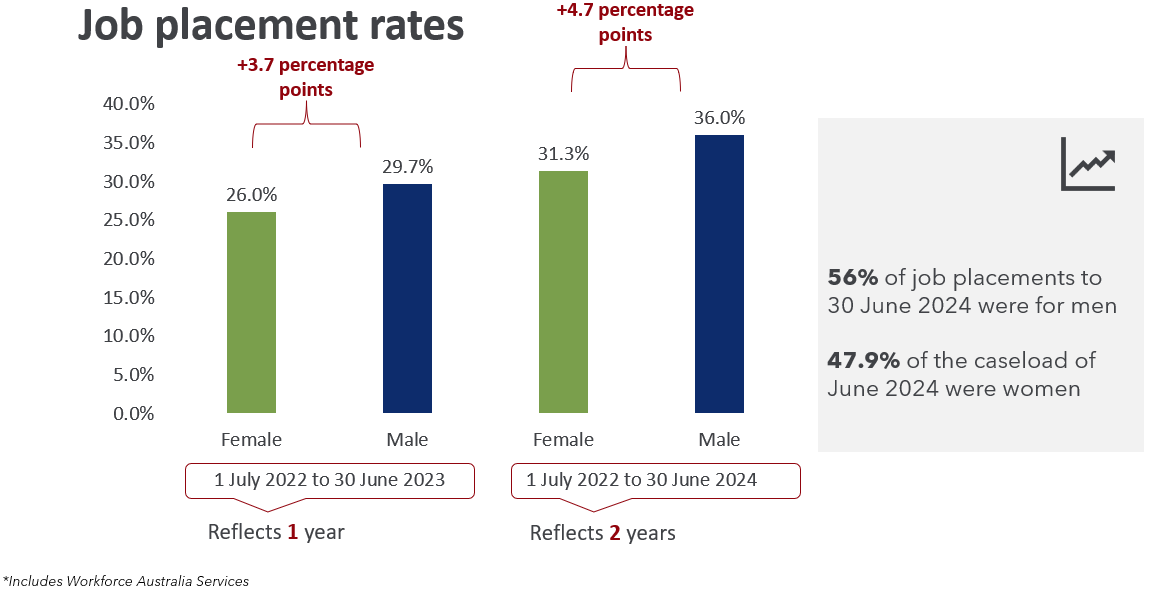
If we start looking at job placement data – because that's the outcome we're aiming for, right?
These are the job placement rates last year and this year. Last year we saw a gender gap of 3.7 per cent, and this year we see it's bigger. We've actually somehow managed to compound the inequitable placement rates by gender. I will be sharing these slides.
That’s a change by about one percentage point, and I wonder why that is? Because in our early system, with early data of course – and we’re noting it's early – it's a new system. But, it seems to not be going in the right direction.
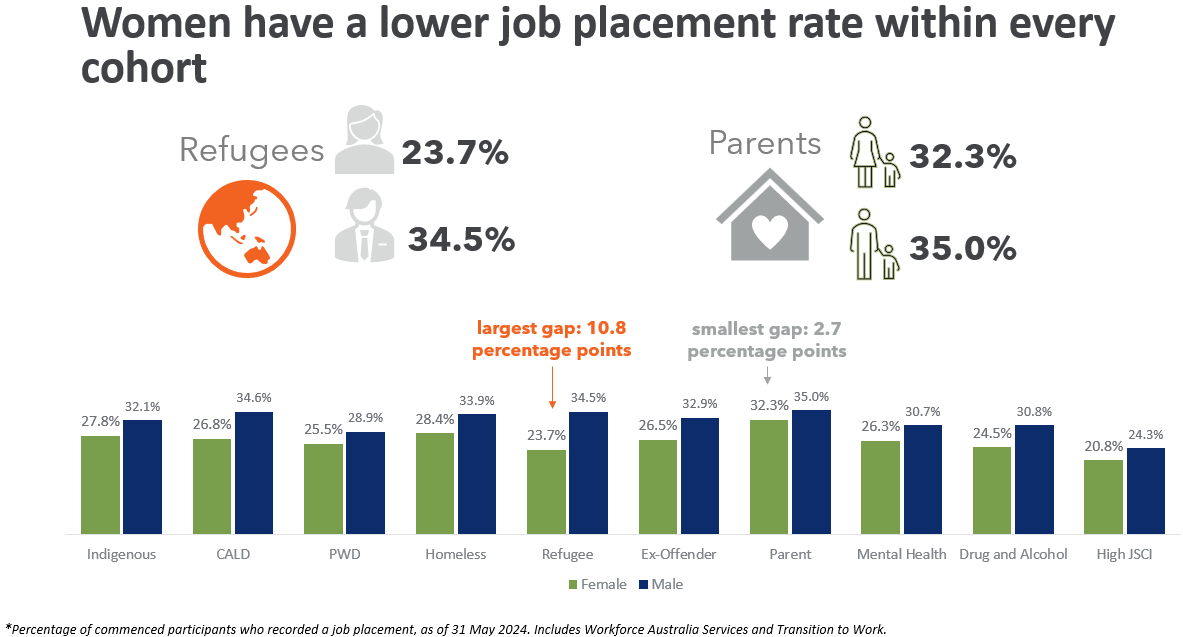
If we break it down by cohort, we see that gap in every cohort. For every cohort, there's a gender gap, that's smaller in some cohorts than others.
Interestingly, for parents, the gap is relatively smaller than, say, refugees, where there’s nearly a 10 per cent difference. There are cultural issues at play here. There are norms. However, that's not an excuse. It's our job to tackle those things. We've got some bigger and smaller gaps.
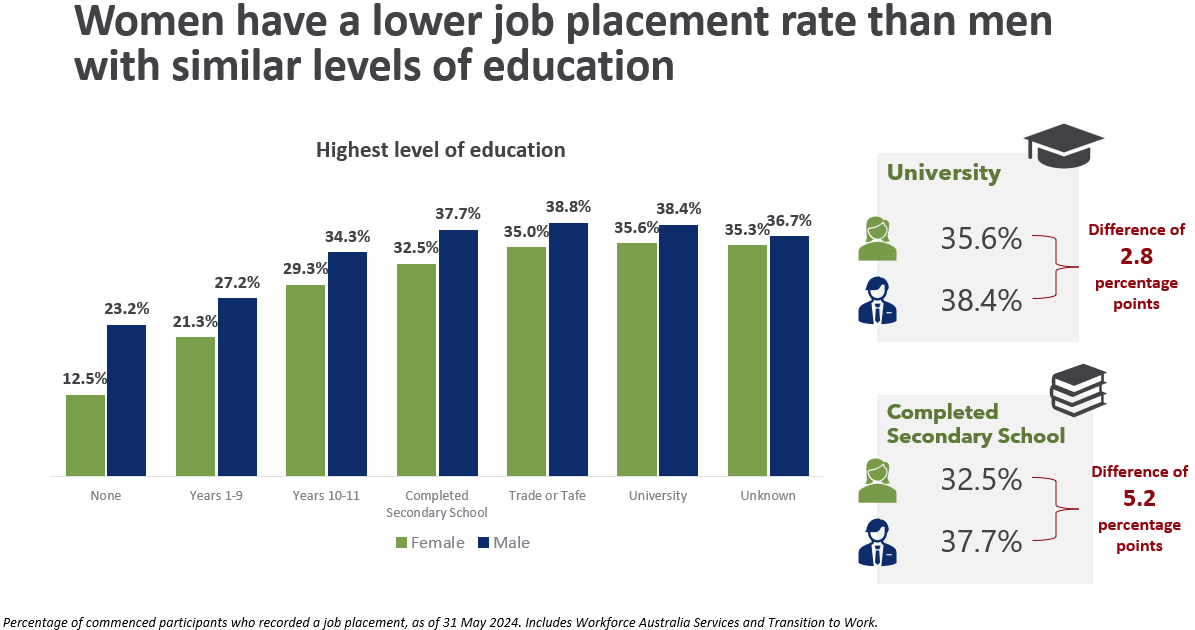
The levels of education is another thing we looked at. Again, we see the gender differentiation across all levels of education when it comes to outcomes. It gets a little bit smaller at the more educated end, but a little bit larger at the secondary school end. You heard Professor Barney Glover also talk earlier about the fact that our graduations from high school are going backwards. Again, it's not about education or a skewing of education.
Gender pay gap
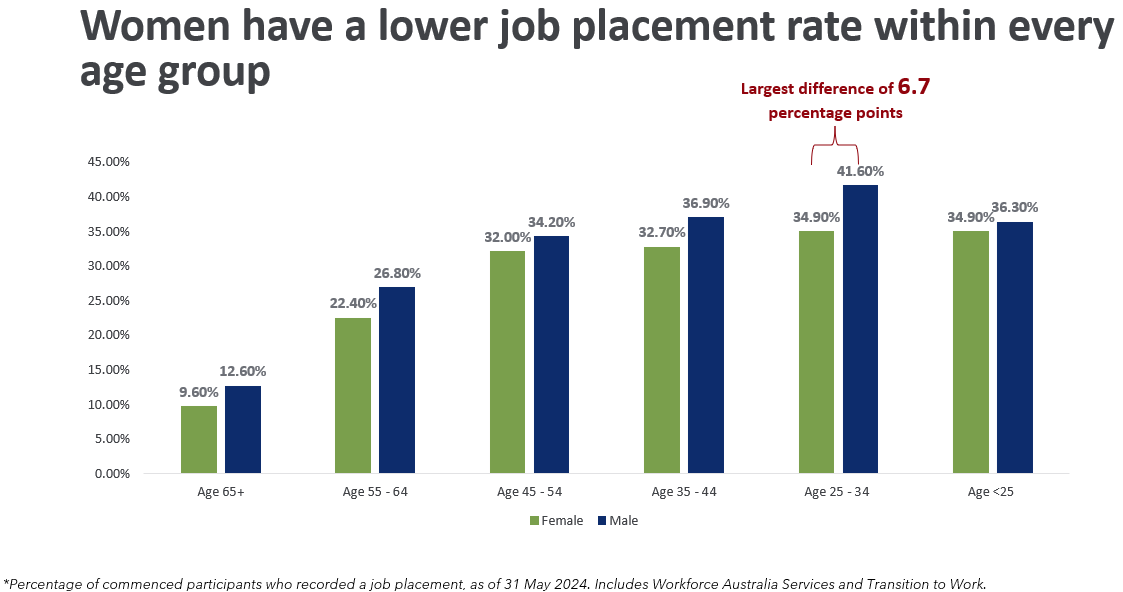
The gender pay gap is also (evident) with age. What we see is that the gender gap persists even when we take the parent cohort out. We might think, ‘is it people with parental responsibilities?’ But when you take it out, you still see a gap.
It’s fair to ask, what role are we all playing with respect to this issue? What's our contribution to the problem and what might be the solution? Unfortunately, if we ask ourselves a question again - is this our fault? It's not entirely anyone's fault, it’s a complex issue. But this is one of the graphs that struck me the most.
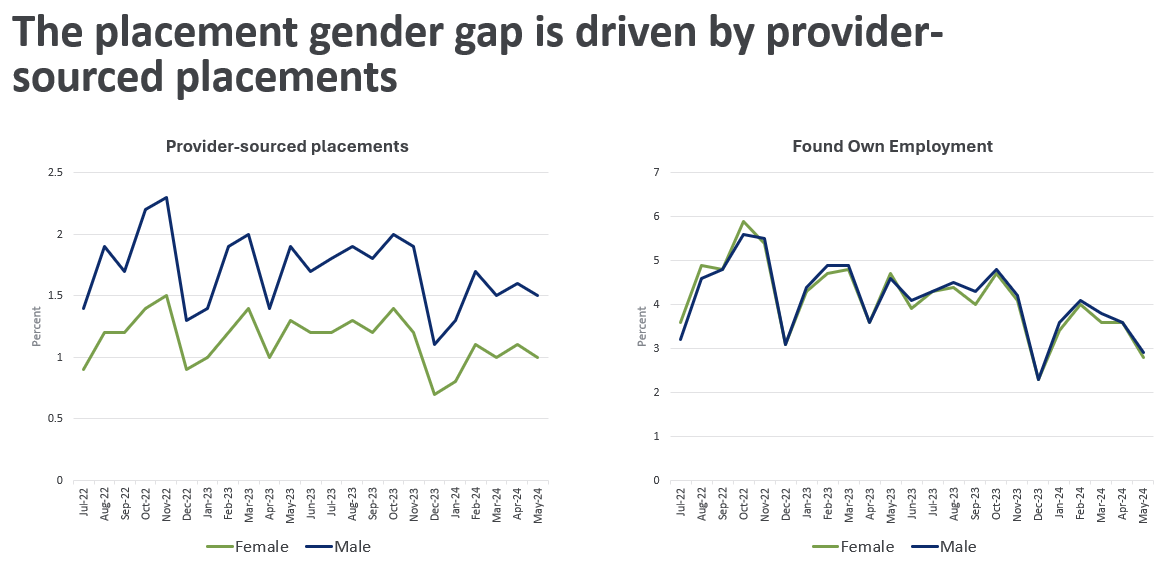
The gap is persistent with provider source placement in a way that doesn't feature in own source placements. Just sit with that for a moment. Only you can know whether unconscious bias or more obvious forms of discrimination are impacting on how your people are treating (the) people they're helping out. Our unconscious bias affects all of us. You have to work hard to tackle that. We all do. But my mission here is to make you conscious, and for us all to think about how we change this.
You heard Professor Glover talk about skill shortages and their greater occurrence in jobs and occupations with a high degree of gender segregation. The jobs are there, skill shortages are across the board, but they are greater in those segregated areas. We need to really look into what norms and stereotypes we are bringing when we're looking at the participant in front of us and thinking about what their potential is. We need to be helping women into these jobs, all of them, not just those that have traditionally been done by women. And none of us can single-handedly change gender norms, or shift the gender-segregated nature of the labour market.
But we need to support all of our participants equally. And if that means challenging stereotypes to achieve an outcome, then yes, that's our job – challenging our own stereotypes, challenging employer stereotypes and helping our employers. You heard the Minister talk about helping employers frame jobs that fit the people, as well as the other way around. Part of that is having culturally safe workplaces and inclusive workplaces.
Supporting women in employment
Now, there are some very direct forms of help that we in the system give people to improve their job prospects. All of the work and casework and support you give them is important. When we're looking at data, the quantifiable aspects are things that we can naturally test pretty easily. We did this last year and we've revisited that. Let's see how we're going. The job placements that are supported by wage subsidies.
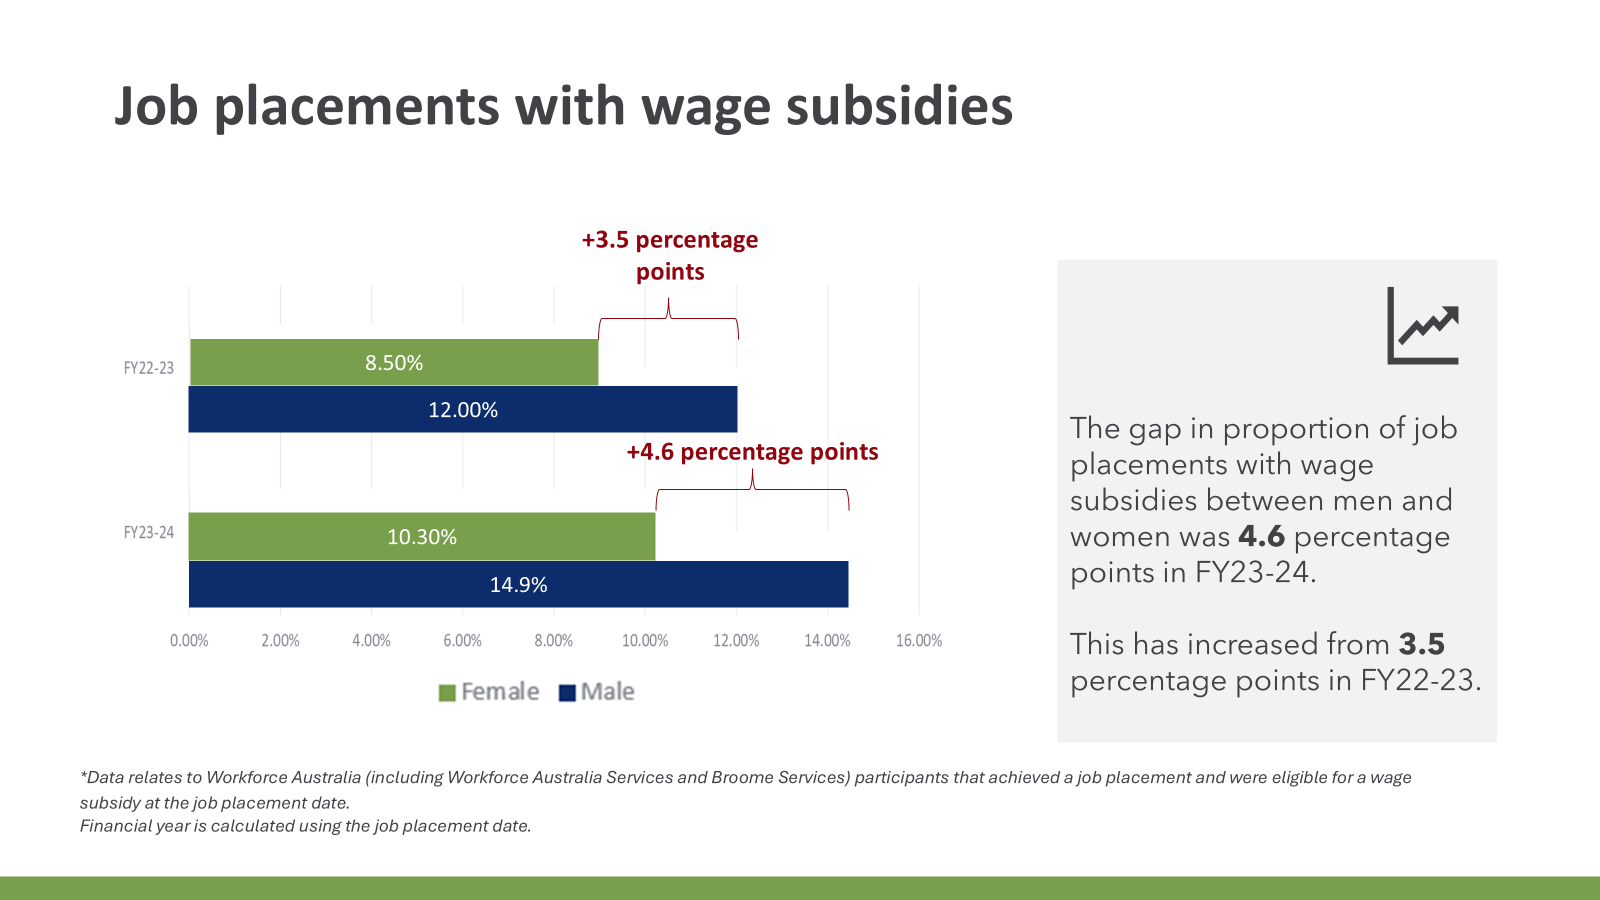
Last year we had a gap and this year it too has gotten bigger by almost 1 per cent. We're not only still spending more wage subsidy money on men, but even more than last year. Here’s some system-wide data, broken down by provider. Some of you have a smaller gap than the average and some of you have a much bigger gap than the average. One of you has a 23 per cent gap in the gendered wage subsidies, in your business, over the last year. Have you noticed this?
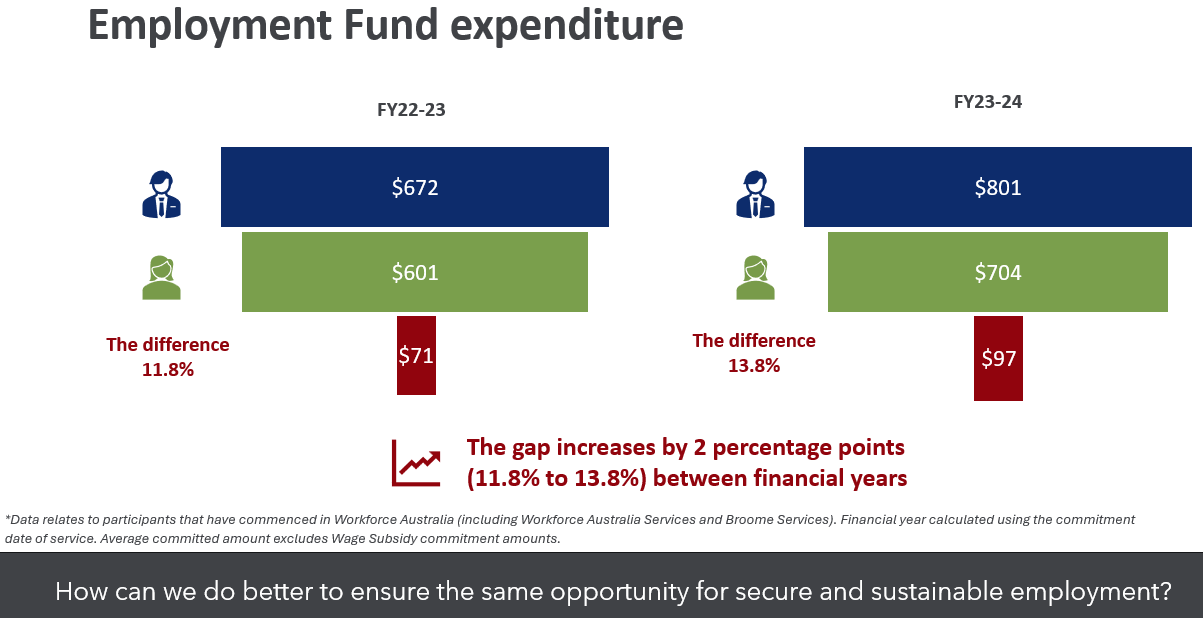
Employment fund expenditure - we looked at this last year, and the difference last year was 11.8 per cent, and this year, 13.8 per cent (it’s) gone up. We tap into the employment fund for a diverse range of things, but if it’s direct support for people, men are getting more of (the employment fund) than women too.
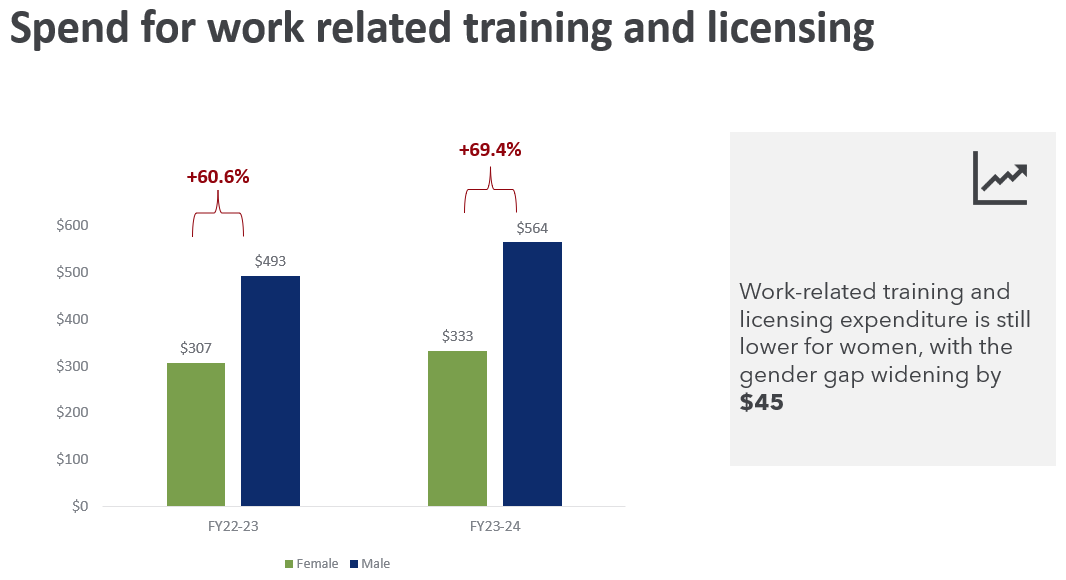
It’s the same when we look at training and licencing, which is a gateway to particular types of jobs and really important. On every data point I look at, this (difference) is there. That tells us we have a systems problem, and a trend, going in the wrong direction.
And, for the sake of completion, I was curious. I think we've looked before at ‘behaviour’ in the system, when it comes to compliance. Now, a compliance system, as we know, is something we are looking to evolve. However, in the current compliance system, we also see a gender gap, but it goes the other way.
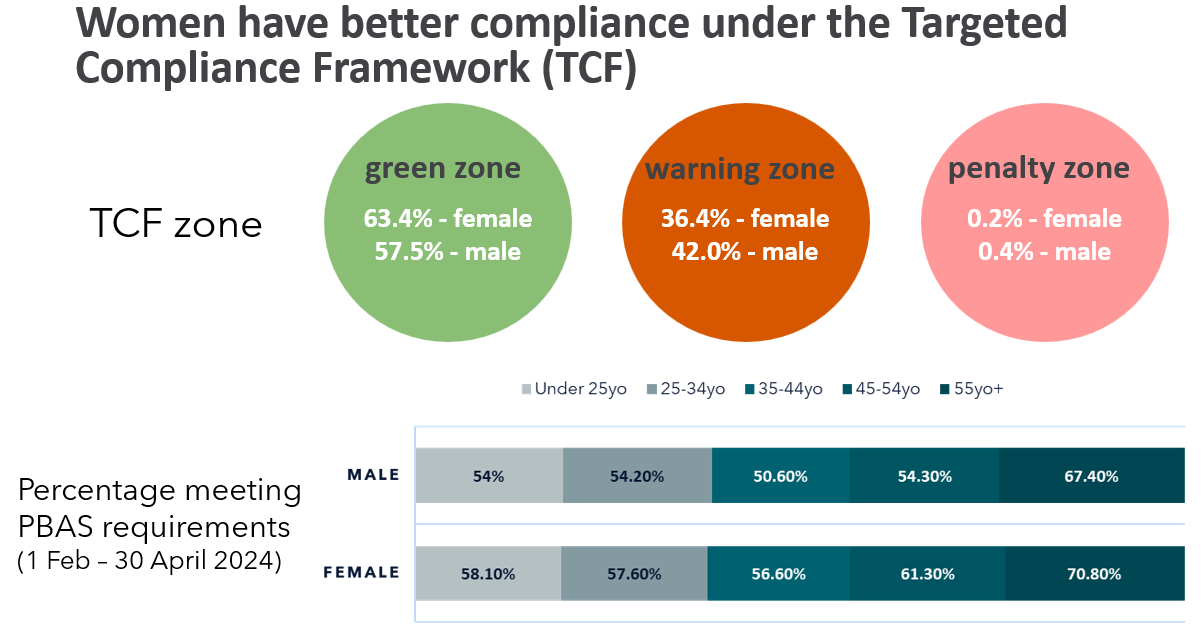
Women are less likely to be attracting penalties and suspensions. If we look specifically, and this (data) is broken down by age, what you can see again is it's (the gender gap) across every age group, it's everywhere, it's persistent and consistent.
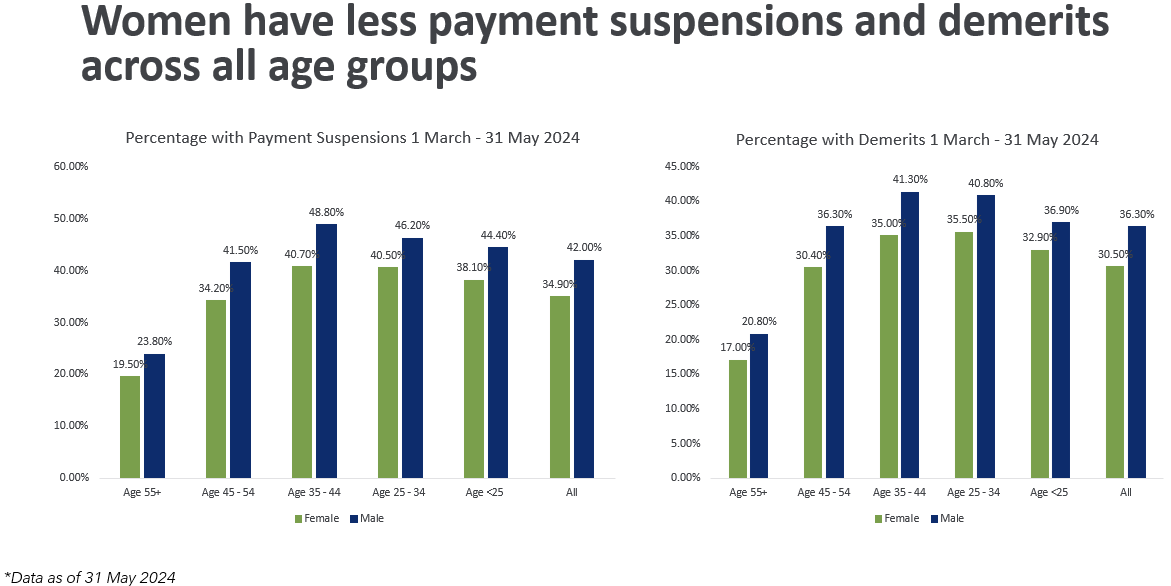
And, dare I say it, the women are doing the right thing by us and we're not doing the right thing by them. This evidence is something we would love to speak with you more about - what are you seeing on the floor? What do you feel? Is this a surprise to you? I asked you that last year.
The evidence says – the numbers say – we're failing women and we're failing women across the board. We need to do more to address the conscious and unconscious bias in our systems, to engage directly with employers, (and) to open up opportunities to drive reputable support for women.
The government, rightly – the people, the community – expect us to deliver an equitable service to all cohorts. Women are a major cohort. We spoke about this last year, and you can access this information. I suggest you pull the data.
The data is not consistent across all providers. That might be reflective of caseload, but again, that's probably the gender norms coming into play. They're not irrelevant, but we need to challenge them.
The landscape
It's a sobering picture, I think. For me, it raises a question about whether gender outcomes need to be included as part of the formal performance framework going forward. One of the things the Minister noted this morning – he talked about the government agreeing with the Select Committee recommendation – that we need to develop new ways to manage provider performance. We need to incentivise the right things. When I'm advising this government about the future licence renewal process, and the performance framework, and payments frameworks, I'll be encouraging them to take this dimension into account.
This has been on my mind because two nights ago, I attended the launch of a new centre, the Australian Centre for Gender Equality and Inclusion at Work. Katy Gallagher, the Minister for Women, who of course is also, the Minister for Finance was there. She gave a keynote speech, and I listened to her talk about a number of key government reforms over the last two years, some of which I've mentioned–about the wage system in workplace relations, changes to ensure more women apprentices and trainees work on construction sites, today's announcement about supporting a pay rise for early childhood workers. And I felt pretty proud of the role that our department played in a number of these achievements.
And as I stand here before you and we talk about these numbers, I think, what do we need to do different to ensure that the system is working for women and not against them? I think there are a number of things there for us to think about.
I am going to take you through the things that have had an impact on me in the last couple of years. Doctor Anne Summers came to see me a little while ago. She met with Tanya and I, and she's done a piece of work on domestic and family violence. Part of that looked at the connection between women who had experienced domestic and family violence and women on income support. And it's high, right?
We need to reflect on the fact that there is a relationship between poverty, income support and family violence. People on your caseload are experiencing domestic violence. Our formal numbers, of (those who have) declared experiencing family violence, sit at around two and a half per cent. But we think that's probably under-reported because it generally is.
We all have a role to play here. Working with sometimes very vulnerable women, but also those women with university degrees who may not be experiencing these sorts of challenges at all, but who just want the right kind of help to help them get a job.
I leave you with that challenge. To think about how we do better from a systems point of view and what you might do better and differently operationally to raise awareness of this issue amongst your staff. And perhaps consider how you are rewarding placements and how you are bringing awareness of the data for your organisation so that your organisation is, along with Workforce Australia more generally, doing the right thing by women.
That's the end of what I had to say today. It's very focused and I'm very happy to hear your feedback on this issue or any other. I know we've had a lot of conversations today that you might have questions about.
Thank you.
